← back
Financial modeling Scenario analysis Reproducible data pipeline Harvard GSD

Spatial Equity at the GSD: Balancing Budget, Space, and People

A financial model demonstrating a sustainable path for the GSD to create a better student experience.

Team: Wyatt Roy, Kalana White, Xavaar Quaranto.
Course: Harvard GSD · VIS 2478: Intangible Design: Organizations · Spring 2026.

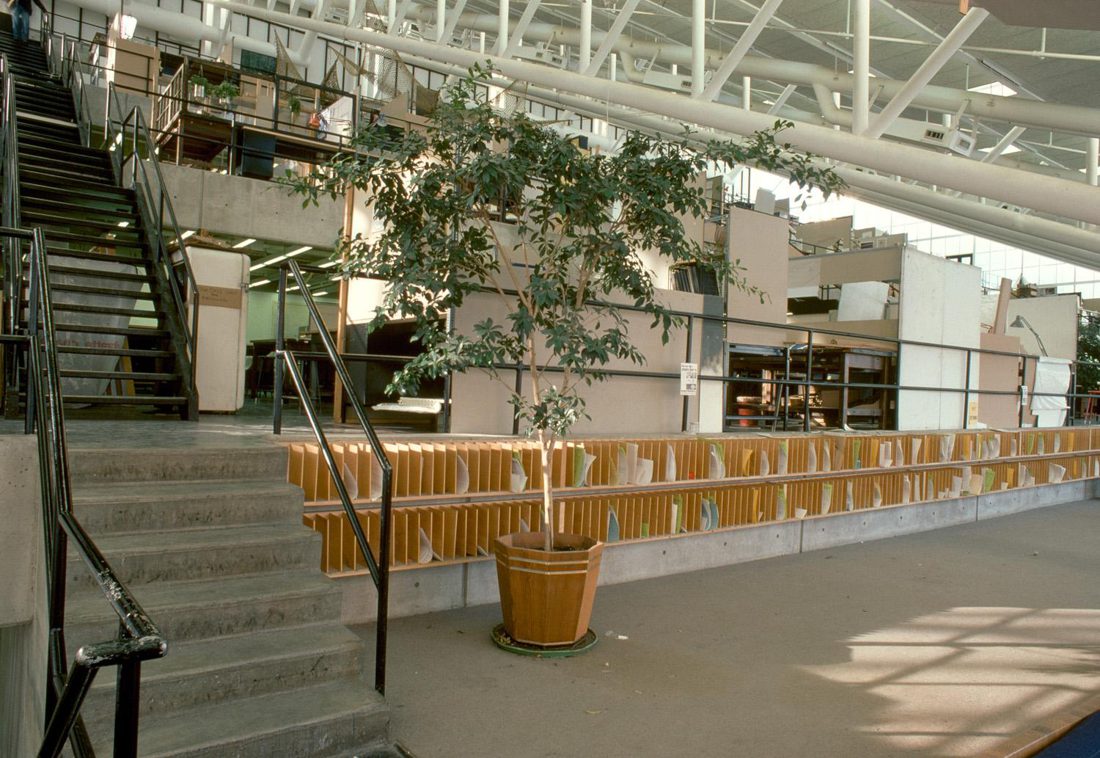
The interior of Gund Hall in 1970: open concrete steps and studio trays with a single potted tree, spacious and uncrowded.
Gund 1970; before space was a luxury
The question

Growth Is Only Beneficial Until the Right Size, How Do We Find What That Size Is?

We started this project with one core question: in light of many students not having access to desks, how do we make space at the GSD, and Gund Hall in particular, work for everyone? Based on research, interviews, and a close examination of the GSD's resources, we realized that at its core the problem we were grappling with is a resource problem; and the question morphed into a much more general one about the financial health of the institution as a whole.

The core issue is described by Wyatt Roy's analogy below:

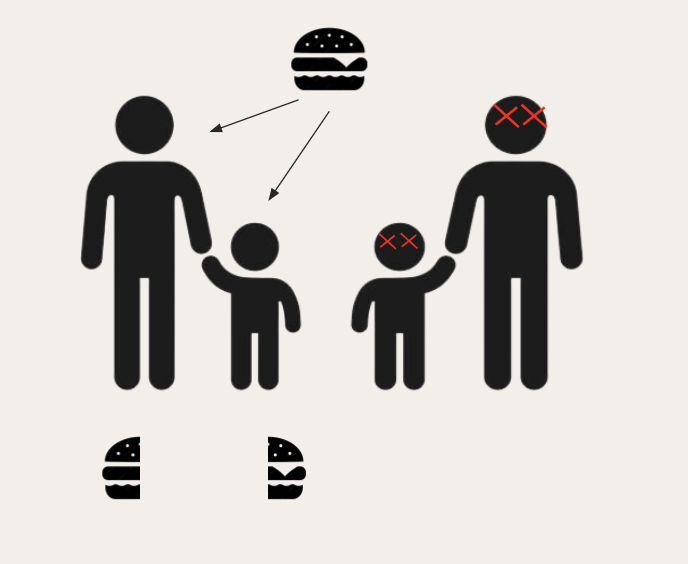
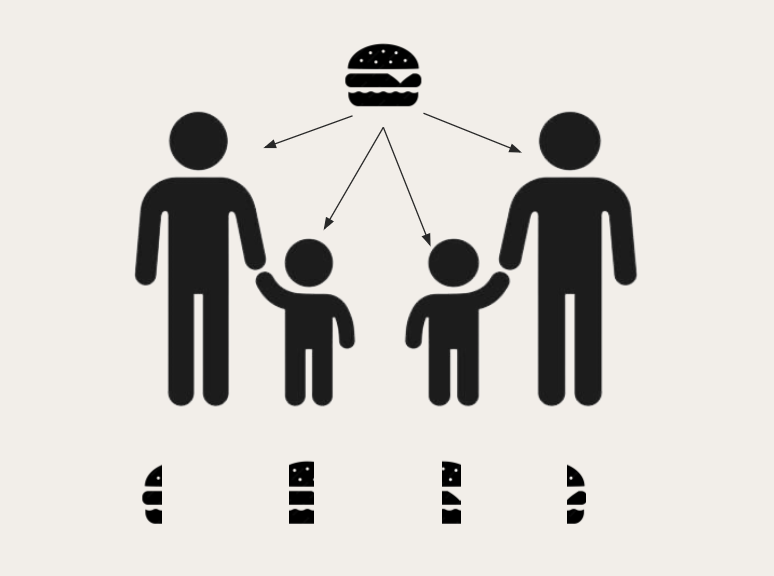
The Hungry Family

There's not enough food to feed everyone properly, but there is just enough to keep everyone alive.

A pictogram: one burger split into small portions shared among two adults and two children, just enough to keep everyone alive.

If the administration took desk space from one group to give to another, it may literally kill the other group. There is so little slack in this system that even talking about "pedagogical effectiveness" feels like a luxury when all stakeholders are just trying not to starve.

A pictogram: the burger given to only one adult and one child; the other adult and child, left with nothing, are shown with crossed-out eyes.

In a resource scarcity problem, there are only three moves: increase the resource, decrease the users, or find scraps and use them better.

Gund Hall, the GSD's home, was designed in the 1960s, with construction beginning in 1969 and the building completed in 1972, around an intended population of 400 students and 70 faculty. The spatial constraints we are feeling today are the result of growth that has far exceeded the building's original intent. This project uses financial modeling to demonstrate how right-sizing the institution, by bringing it closer to its original intent, would both alleviate space scarcity and balance the budget in a manner that can be sustained well into the future.

01 · Where the school stands

The School Is Structurally Unstable

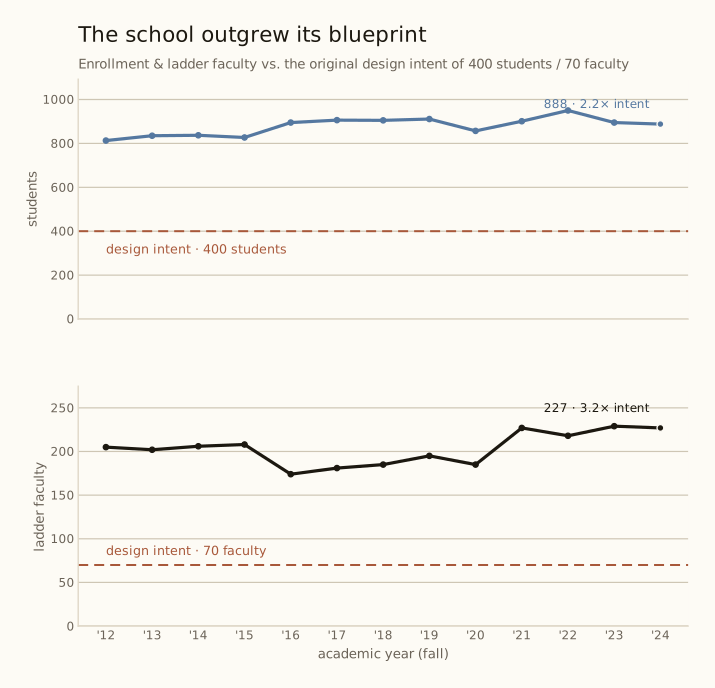
Against a design intent of 400 students and 70 faculty, today's GSD runs at roughly twice and three times those numbers. The school has more than tripled its teaching corps relative to the original plan while enrollment only doubled. While the GSD has added square footage to its total footprint by acquiring additional buildings, the fact is that most academic energy is still concentrated in the main building. Furthermore, there's a case to be made that this expansion has only exacerbated budgetary constraints.

Being oversized is not only a matter of crowding; it is a structural cost problem. Each student costs the school about $87,000 a year to educate but pays about $39,000 in net tuition, so every seat is subsidized roughly $48,000 from the endowment and gifts.

Adding students widens that gap rather than closing it. From AY15‑16 to AY24‑25 expenses and revenue have grown nearly in lockstep, at about 3.4% a year. Where has this additional revenue come from? Over the past decade almost all of the GSD's revenue growth came from just two sources, net tuition and the endowment draw, about $11M each; gifts and sponsored research actually shrank.

Critically, tuition did not grow because of enrolling additional students. It was price: net tuition per student rose about 3.5% a year, well ahead of inflation.

With this in mind, holding the population steady is not an option either: if the GSD stays at its AY24‑25 population of 888 students while expenses continue to inflate at 3-4% a year, the budget will either slip into deficit within a few years or tuition will have to keep rising, putting it even further out of reach of many students. Hold tuition affordable and the school runs deficits; raise it to keep pace and it prices people out.

We already see this squeeze playing out in the data over the past decade, with the school paying for its overgrowth by making each seat steadily more expensive. The problem is therefore the structure of the institution, the ratio of people to resources, not the pace of growth, and shrinking is the one move that raises resources per student instead of chasing costs.
Revenue sourceAY15‑16 → AY24‑25ChangeShare of growthCAGR
Net tuition$23.6M → $34.6M+$11.0M52%+4.3%/yr
Endowment draw$19.4M → $30.1M+$10.7M50%+5.0%/yr
Other (lumpy)$6.5M → $9.5M+$3.0M14%+4.3%/yr
Current-use gifts$7.1M → $6.1M-$1.0M-5%-1.7%/yr
Sponsored research$2.9M → $0.6M-$2.3M-11%-16%/yr
Total revenue$59.5M → $80.8M+$21.3M100%+3.5%/yr
Table 1. Where the GSD's revenue growth has come from, AY15‑16 to AY24‑25. Two engines, net tuition and the endowment, do nearly all the work; the tuition half is price per student, not enrollment. Source: Harvard GSD Fact Books & GSD-provided data
Two line charts, AY12-13 to AY24-25: students hold near 800 to 950 far above a 400-student design-intent line; ladder faculty near 175 to 230 far above a 70-faculty line.
Figure 1. Actuals vs. the original design intent. By AY24‑25: 888 students (2.2×) and 227 ladder faculty (3.2×). Source: Harvard GSD Fact Books & GSD-provided data
  • Student-to-faculty ratio today: 3.9 : 1, richer than the design's 5.7 : 1.
  • Operating expenses have climbed to $77.5M; salaries are the fastest-growing line.
  • The school runs near break-even: about $81M revenue vs. $78M expenses, a thin ~$3M margin.

How the Model Works

The counterfactual is a small financial model built from primary sources: Harvard GSD Fact Books and financial reports. A large share of the work happened before any modeling at all, in the calculation and reconciliation needed to turn messy, inconsistent, year-to-year sources into the single consolidated table it all rests on.

  1. Assemble the ledger. Thirteen years of enrollment, faculty, staff, revenue, expense, and endowment figures, reconciled from Fact Books and financial statements into one consolidated table.
    Table 2 · source data · consolidated_comparison
    YearStudentsStu Δ%FacultyFac Δ%StaffOp. rev ($M)Op. exp ($M)Salaries ($M)Endow. ($M)Stu ×intentFac ×intentOp.exp/stu ($k)
    AY12-13813n/a205n/an/an/an/an/a396.32.032.93n/a
    AY13-14835+2.7202-1.5n/an/an/an/a442.42.092.89n/a
    AY14-15837+0.2206+2.0n/an/an/an/a452.92.092.94n/a
    AY15-16827-1.2208+1.0n/a59.557.525.5427.62.072.9769.5
    AY16-17895+8.2174-16.3n/a61.755.925.4455.02.242.4962.5
    AY17-18906+1.2181+4.0n/a63.962.726.6480.12.272.5969.2
    AY18-19905-0.1185+2.216167.563.328.0490.62.262.6469.9
    AY19-20911+0.7195+5.415970.061.230.0503.22.282.7967.2
    AY20-21857-5.9185-5.115856.055.629.5647.42.142.6464.9
    AY21-22901+5.1227+22.717567.870.632.3652.42.253.2478.4
    AY22-23950+5.4218-4.017472.671.033.3643.42.383.1174.7
    AY23-24895-5.8229+5.0n/a75.673.934.2674.72.243.2782.6
    AY24-25888-0.8227-0.9n/a80.877.537.7n/a2.223.2487.3

    Reconciled from Harvard GSD Fact Books & financial reports. "n/a" where the source did not report a value.

    Table 3 · calculated assumptions · model inputs
    AssumptionValueHow it is derived
    Net tuition per student (base)$38,964AY24-25 net tuition $34.6M / 888 students
    Net tuition per student growth+1.0%/yrempirical net-tuition/student CAGR, AY13-14 to AY24-25
    Expense inflation+4.0%/yrHEPI (higher-education price index), nominal-consistent with the endowment
    Endowment payout (base)$30.1MAY24-25 distribution
    Endowment market value$675MAY23-24 Fact Book
    Endowment payout rate4.5%effective draw / prior-year market value, AY16-24
    Endowment net growth5.0%/yrobserved net corpus CAGR ~4.95%, AY12-24; tested at 3% and 7%
    Other revenue (held flat)$16.2MOther $9.5M + Current-Use Gifts $6.1M + Sponsored $0.6M (AY24-25)
    Fixed expenses (held flat, then inflated)$16.1MSpace $8.8M + Other $7.3M (AY24-25)
    Variable expenses (scale with headcount)$61.4MSalaries $37.7M + Benefits $10.4M + Services $8.1M + Supplies $1.9M + Travel $3.3M (AY24-25)
    Students (today to design intent)888 to 400AY24-25 actual to the 1970s 400-student intent
    Headcount, faculty + staff (today to softened target)401 to 197AY24-25 to right-sized end-state (faculty ~102, core admin protected)
    Glide10 yr linearlinear reduction over 10 years, then held flat

    Derived inputs that drive the model, each calculated from the consolidated ledger above. The growth rates put every projected series on one nominal-dollar basis.

  2. Split cost behavior. Every expense line is classed variable (scales with headcount) or fixed (space, core admin) from a single categorization rule, so the model knows what actually shrinks when the school shrinks.
    Table 4 · cost decomposition · finance_categorization
    CategoryLine itemClassHow it scales
    RevenueNet Tuitionvariableper-capita tuition × student count
    RevenueEndowmentfixedheld flat at AY24-25 value ($30.1M)
    RevenueOther*fixedheld flat at AY24-25 value ($9.5M)
    RevenueCurrent Use Giftsfixedheld flat at AY24-25 value ($6.1M)
    RevenueSponsored Researchfixedheld flat at AY24-25 value ($0.6M)
    ExpenseSalariesvariableper-capita salary × (faculty + staff)
    ExpenseBenefitsvariableper-capita benefits × (faculty + staff)
    ExpenseSpace**fixedheld flat at AY24-25 value ($8.8M)
    ExpenseOther*fixedheld flat at AY24-25 value ($7.3M)
    ExpenseServices Purchasedvariableper-capita × (faculty + staff)
    ExpenseSuppliesvariableper-capita × (faculty + staff)
    ExpenseTravelvariableper-capita × (faculty + staff)

    The single source of truth for what scales with the school's size and what stays fixed. Variable lines drive the right-sizing savings; fixed lines (Gund Hall, core admin, endowment draw) do not.

  3. Project the endowment. The roughly $675M corpus is grown forward at the ~5% net rate it has historically averaged. What the school can actually spend is not the principal but the payout it distributes each year, about 4.5% of the corpus, and because that draw is a slice of a compounding base it climbs on its own, regardless of how many students the school enrolls. The projection is run at 3% / 5% / 7% growth to bound how much that future return swings the outcome.
    Table 5 · projection inputs · endowment_projection
    InputValueHow it is derived
    Endowment market value (base)$675MAY23-24 Fact Book, carried forward to the AY27-28 launch
    Payout rate4.5%effective draw / prior-year market value, AY16-24 (AY24-25 draw $30.1M / $675M = 4.46%)
    Payout at launch$30.1MAY24-25 distribution
    Net corpus growth (base)5.0%/yrobserved net corpus CAGR ~4.95%, AY12-24
    Growth sensitivity bounds3% / 7%low / high paths bounding the 5% base case
    Launch year (t = 0)AY27-28earliest future start; base values carried forward from last actuals
    Projection window10 yrAY27-28 to AY37-38 shown here (the corpus keeps compounding beyond)

    The growth rate is already net of payout and inclusive of historical gifts, not a gross investment return.

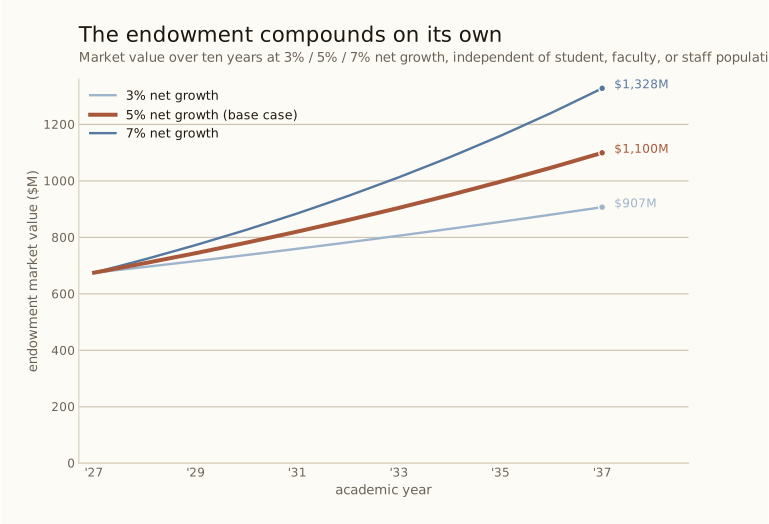
    Three rising curves of endowment market value over ten years from a shared $675M start in AY27-28: at 3% net growth it reaches about $907M, at the 5% base case about $1,100M, and at 7% about $1,328M by AY37-38.
    Figure 2. Endowment market value compounding over ten years at three net-growth rates, independent of student, faculty, or staff population: $907M at 3%, $1,100M at the 5% base case, and $1,328M at 7% by AY37‑38. Source: Harvard GSD Fact Books & GSD-provided data
  4. Find where the budget works. The size floor is the 400-student design intent. By regressing revenues and expenses along that path we find where the growing endowment overtakes shrinking tuition and how much of the budget it can cover.scenario engine · rightsize_budgetintegration · counterfactual_integrated

Each step is a committed script that writes a SQL table and a report; the whole suite regenerates from the database with one command. Nothing is hand-tuned.

02 · The funding engine

The Endowment Is the Engine

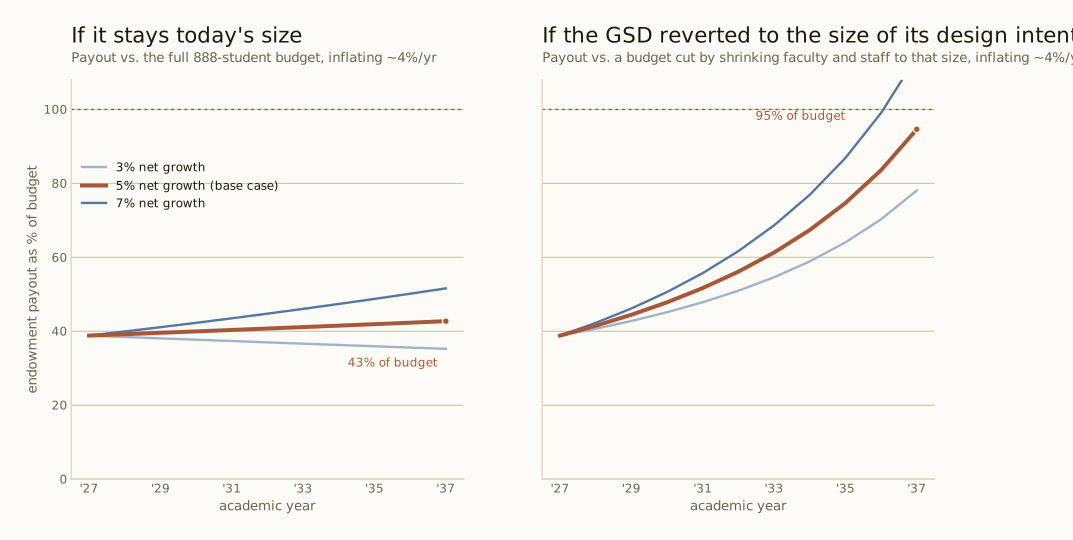
The GSD's endowment sits around $675M and has grown roughly 5% a year net of payout, and that compounding is the whole game. What share of the budget its payout can cover depends on how big that budget is, and the budget shrinks not by enrolling fewer students but by employing the smaller faculty and staff a 400-student school actually needs. Two bounding cases fix the range, both inflating about 4% a year (HEPI): held at today's size, the payout climbs only from about 39% to 43% of the budget; cut to the design-intent size, it covers 39% rising to about 95%. By the end of that glide the endowment payout and gifts alone exceed the smaller budget, so the school would run a surplus even if net tuition held flat or fell to nothing. Any realistic path sits between the two bounds.

Two side-by-side line charts of endowment payout as a percent of the budget over ten years at 3, 5 and 7 percent net growth. Left, against today's full-size 888-student budget, the base case rises only from about 39 to 43 percent. Right, against a budget cut by shrinking faculty and staff to the 400-student design intent, the base case rises from 39 to about 95 percent and the 7 percent case passes full coverage. Both budgets inflate at about 4 percent a year.
Figure 3. Endowment payout as a share of the budget over ten years, at 3% / 5% / 7% net growth, against the two bounding budgets (both inflating ~4%/yr): the school held at today's 888-student size (left) and reverted to its 400-student design intent (right). In the base case the payout covers about 43% if the school stays large, or about 95% once faculty and staff are cut to that size. The truth for any real glide sits between. Source: Harvard GSD Fact Books & GSD-provided data
03 · Right-sizing

The Safe Size Is Far Below the Current Size

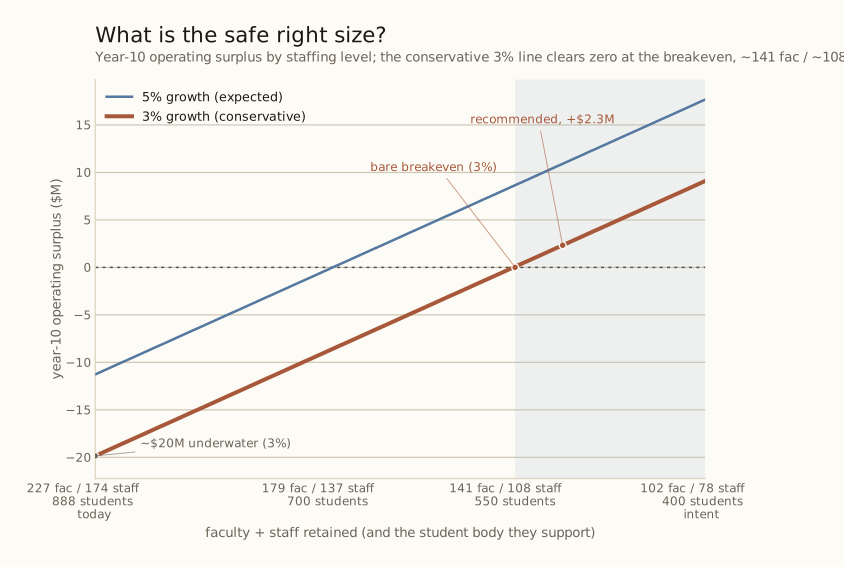
Faculty and staff salaries are the bulk of the budget, so the number that actually moves the finances is how many people the school employs, not how many students it enrolls. Shrink faculty and staff in proportion as the school right-sizes, hold the building and core admin, and the operating surplus climbs as payroll falls faster than the tuition a smaller student body brings in. At today's 401 faculty and staff a conservative 3% endowment decade leaves the school about $20M underwater; the surplus does not clear zero until faculty and staff fall to roughly 141 and 108 (a student body near 550). And this is not a problem the endowment can grow its way out of: even at the expected 5%, keeping today's 401 faculty and staff runs about $11M underwater, and headcount has to fall to about 315 (roughly 700 students) just to break even.

The recommendation is therefore a staffing target, not an enrollment one. Breaking even under the pessimistic 3% case takes faculty down to about 141 and staff to about 108, but sitting exactly on breakeven leaves no cushion for a bad decade. So the plan cuts a step deeper, to about 131 faculty and 101 staff, which clears roughly +$2.3M even at 3% and about +$11M at the expected 5%. That surplus is both the margin of safety and the room to hire some positions back, which is what keeps the cut generous rather than austere. Going further, toward the 400-student design intent and its 102 faculty, would throw off more still, but every step beyond this point comes out of faculty positions; protecting those is why the recommendation stops here rather than at the floor.

Students come down in proportion too, and that is what protects the experience rather than eroding it. Holding the faculty-to-student ratio keeps each student's share of teaching attention constant, and thinning the student body de-crowds Gund Hall, so the students who remain get more space and resources, not less. Matching about 131 faculty to roughly 515 students holds that ratio at a school the institution can actually sustain. Right-sizing is not a budget trick played on students; it keeps the education intact and makes it affordable.

A line chart of year-10 operating surplus versus the faculty and staff retained, from 227 faculty and 174 staff today down toward the 400-student design intent, cut in proportion. Two rising lines, 3 percent conservative and 5 percent expected endowment growth. The conservative line crosses from deficit into surplus at about 141 faculty and 108 staff, the bare breakeven; a marker at about 131 faculty and 101 staff shows the recommended cut, which clears about 2.3 million dollars even under the conservative case. At today's staffing the school is about 20 million dollars underwater under the conservative case.
Figure 4. Year-10 operating surplus by staffing level, faculty and staff cut in proportion. Under the conservative 3% case the budget only clears zero at about 141 faculty and 108 staff (a student body near 550), the bare breakeven; the recommendation cuts a step deeper, to about 131 faculty and 101 staff (near 515 students), which buys roughly +$2.3M of cushion even at 3% and the room to re-hire. Net tuition per student is held to +1%/yr throughout, a deliberate affordability assumption: the historical rate was ~3.5%/yr, but sustaining that is the pricing-out path this project argues against. Source: Harvard GSD Fact Books & GSD-provided data
  • The recommended size: faculty to about 131 (from 227) and staff to about 101 (from 174), roughly 230 people supporting a student body near 515, which clears about +$2.3M even under the conservative 3% case.
  • At today's 401 faculty and staff the school runs about $20M underwater through a 3% endowment decade; the bare breakeven is near 250, and the recommendation sits a step below it for margin.
04 · The whole picture

The Whole Picture

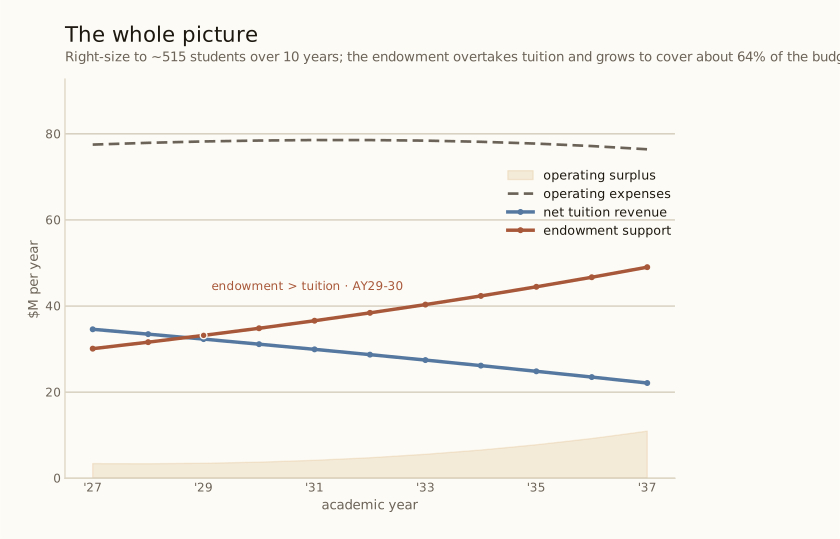
Put revenue and expenses for the recommended plan on the same ten-year glide. As enrollment falls to ~515, net tuition shrinks, but the endowment keeps growing, so its draw rises as a share of expenses and overtakes tuition early, in AY29-30. That share keeps climbing, and against ~4%/yr cost inflation it reaches about 64% of the budget by year 10. The school runs a small, widening surplus the whole way, room it can put toward key programs rather than just staying solvent.

That shift is what buys the school room to choose. The more of the budget the endowment covers, the less it depends on revenue it has to chase, and the fewer reactive decisions that dependence forces: enrolling more students than Gund Hall was built for to book their tuition, shaping research around what sponsors will fund, or deferring upkeep when cash is tight. The more of the budget the endowment covers the more pressure is taken off and the more freedom is gained to set admissions, research, and facilities by mission instead of by cash flow.

Lines from AY27-28 to AY37-38 for the recommended ~515 plan: operating expenses roughly flat near $76M, net tuition falling from about $35M to $22M, endowment support rising from $30M and crossing tuition around AY29-30, reaching about $49M or 64% of the budget by year 10; a small surplus band along the bottom.
Figure 5. Launch AY27‑28. Endowment overtakes tuition at AY29‑30 and grows to about 64% of the budget by year 10, still short of full coverage; the operating surplus stays modest, around +$3.4M to +$11M. Net tuition per student is held to +1%/yr here, the same affordability assumption used throughout (the historical ~3.5%/yr would price students out). Source: Harvard GSD Fact Books & GSD-provided data
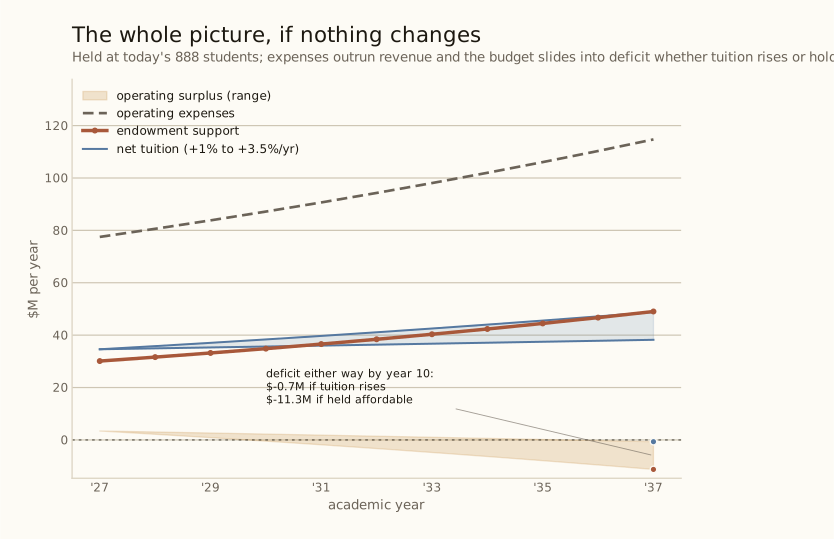
The same four series as Figure 5, from AY27-28 to AY37-38, but with the school held at today's 888 students. Operating expenses (dashed) climb from about $78M to $115M. The endowment draw rises from $30M to $49M. Net tuition is a shaded band between the affordable plus 1 percent a year path, reaching about $38M, and the historical plus 3.5 percent a year path, about $49M. A shaded operating-surplus band along the bottom starts near plus $3M and widens into deficit, from about minus $0.7M if tuition rises to about minus $11.3M if held affordable by year 10.
Figure 6. Hold today's 888 students and the outcome turns on tuition policy, not the cut. Keep raising net tuition at the historical +3.5%/yr and the budget only scrapes by, about -$0.7M by year 10, at the cost of pricing students out; hold tuition to an affordable +1%/yr and it slides to about -$11M. Standing still is a choice between deficits and unaffordability, not a safe default. Source: Harvard GSD Fact Books & GSD-provided data
05 · The per-student case

Costs per Student Rise but So Do Resources

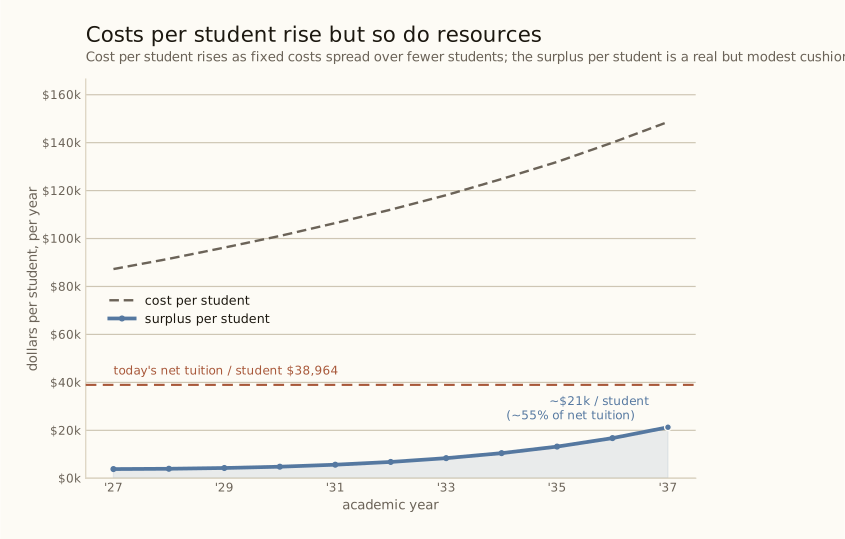
Cost per student actually rises, from about $87k to $149k, because the fixed costs (Gund Hall, core admin) would now be spread over fewer students; right-sizing is not a per-student efficiency play.

The operating surplus per student does climb as the school shrinks, and at the recommended population of ~515 students it reaches about $21,000 by year 10, roughly 55% of today's net tuition per student (~$38,964).

Right-sizing generates solvency and a real but modest cushion per student, not a windfall. Shrinking the school even more would actually throw off more surplus and free up even more space per student, but this is a reasonable middle ground since the school has added additional programs and capabilities since Gund was built.

Cost per student rising from about $87k to $149k, well above a dashed line at today's net tuition per student of $38,964; surplus per student rising from about $3.8k to about $21k, staying below that tuition line.
Figure 7. Cost per student rises to about $149k as fixed costs spread over fewer students; the surplus per student climbs to about $21,000, roughly 55% of today's net tuition per student (~$38,964). Source: Harvard GSD Fact Books & GSD-provided data
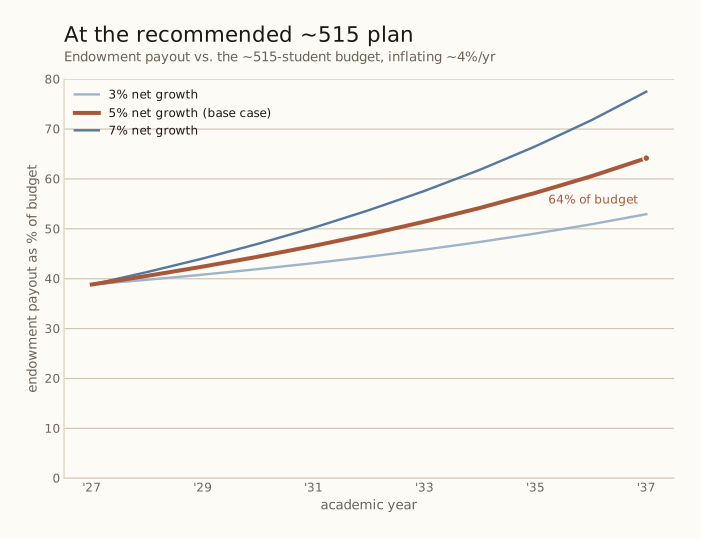
A single line chart of endowment payout as a percent of the recommended 515-student budget over ten years at 3, 5 and 7 percent net growth. All three lines start near 39 percent in year 1. By year 10 the conservative 3 percent case reaches about 53 percent, the 5 percent base case reaches about 64 percent, and the 7 percent case reaches about 78 percent.
Figure 8. At the recommended ~515 plan the endowment payout covers about 53% (3% growth), 64% (5% base case), or 78% (7% growth) of the budget by year 10, all starting near 39% in year 1. Compare Figure 3, which plots the same metric against the two bounding budgets: the 888-student ceiling and the 400-student floor. Source: Harvard GSD Fact Books & GSD-provided data
A smaller school could fund most of its budget from the endowment, and lean far less on tuition.
In the recommended scenario the endowment funds about 64% of the budget and has overtaken tuition as the largest single revenue line; net tuition falls by roughly a third, and the school runs a modest, widening surplus. It turns a structural deficit into a cushion, and the school's dependence on tuition shrinks. The institution is granted the freedom to spend those extra resources on deeper financial aid, facilities improvements, or additional resources for students.
The fine print

Key Assumptions

The model rides on the gap between endowment growth and inflation.

The surplus comes from the endowment compounding faster than costs inflate, so what matters is the spread between the two, not either number alone. Even 5% growth against 4% inflation covers only about 64% of the budget by year 10; let cost inflation reach 5% and that slips to 58%. The flip side is a lever closer to the school's own hands than market returns are: it cannot set inflation, but bending its own cost growth even a point below the sector is worth as much as a point of extra endowment yield, and it makes every projection here healthier. Right-sizing alone does not get there.

How much payout is reallocable?

The endowment's restricted-vs-unrestricted split is unknown (ENDOW‑Q1). Restricted gifts can't be pointed at any budget line, so even the ~64% coverage the model shows is an upper bound.

The payout rate is a proxy.

The model uses the realized ~4.5–5% as a stand-in for Harvard's formal payout policy (ENDOW‑Q2), then stress-tests 3% / 5% / 7%.

Launch values are carried forward.

True AY25‑26 and beyond figures aren't public yet; today's enrollment may already be higher, which would only deepen the overshoot.

A smaller school is a smaller school.

Right-sizing means fewer faculty, fewer staff, and less tuition revenue in absolute terms, and the GSD becomes a smaller part of Harvard. The case here is that resources per person improve, not that the institution grows.

Selectivity cuts both ways.

A smaller selective GSD is a more exclusive one. This study argues that heightened selectivity would actually raise the program's prestige. On the other hand accessibility would decrease.